
In this project, a supervised machine learning model that predicts the corn yield for more than 100 counties in the Corn Belt area was trained using weather and soil data. More than 30 gigabytes of weather and soil data from years 1980 - 2022 were scrapped from several websites for the model training. Instead of a complex time series prediction, this model builds 12 separate random forests corresponding to 12 months to give monthly update of corn yield for each county. This test mean absolute percentage error can achieve 15% when using the full weather and soil data (April to next October) averaged on predictions of all counties.
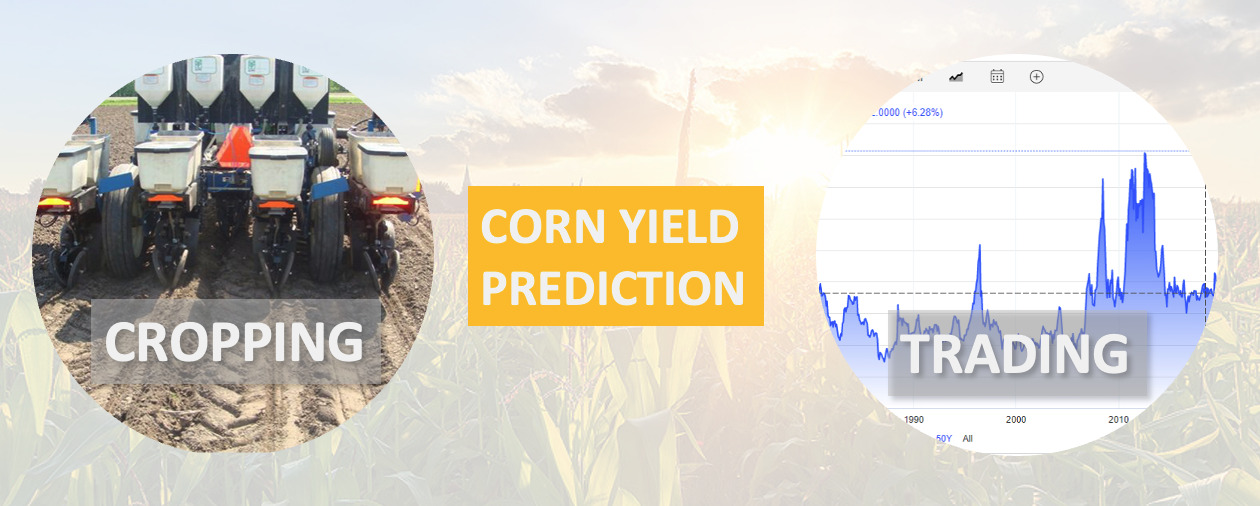
Hello everyone! Thank you for visiting one of my Data Science Project! This project aims to predict the annul corn yield using a machine learning model based on the weather and soil data such as the average perception and temperature of each month. This model will help farmers to better organize their work and traders in the futures market make decisions. Why am I interested in building a machine learning model to predict the corn yield? First, it can be helpful for agriculture and corn cropping activities. Second, it might help the traders in a future market to make decisions. And more importantly, I spent five years in a university that is surrounded by hundred miles of corn fields! Therefore, I am very familar with corn farmers, livestock and poultry houses that use corn as feed and I want to do something to help them.
We can see from the following figure that there is a corn belt in the Midwest area, which produces more than 50% of corn yield in the US. To facilitate corn growth, many weather stations have been established in this area to routinely post weather data on their websites that is critical for corn growth.

Therefore, we can use web scraper to get the data from the websites that publish weather data.
There are three different groups of feature data collected that could be related to corn yield.
The first one is weather data such as rainfall, temperature, and wind speed.
They play great roles in corn yield, however, the relationship between these features and corn yield is more than a simple positive or negative correlation.
For example, if the rainfall is sufficient in corn’s grown season, the yield might be increased.
However, when the rainfall is too heavy to be drained, the corn yield will decrease beacuse there is not enough Oxygen for the root of corn plant.
Another example is the wind speed,
moderate wind speed is beneficial to evaporate the standing water in field.
Whereas strong wind will damage the corn plant.
Therefore, several daily features such as average, minumum and maximum temperatures and rainfall data were collected on
https://mrcc.purdue.edu/CLIMATE
between 1980-2022 for all the counties (if the data is applicaple) in the corn belt area.
The wind data were collected on
https://www.wunderground.com.
The averaging of each year’s data was performed between April to October,
because corn is usually planted in April and harvested in October.
Assuming only perception (pcpn) and average temperature features (avg_t) are used, then for each county and for each month m, the training and testing data will be organized as follows:
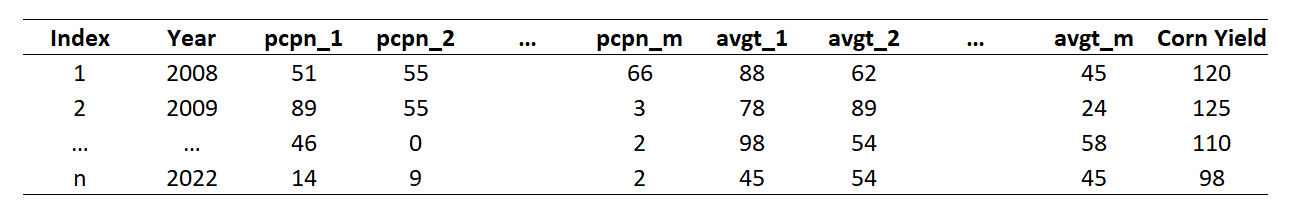
In the above table, there are n samples and 2 * m + 1 columns of features (the "Year" column is also a feature because along with the improvement of gene and fertilizer engineering, the corn yield will be improved over time). And for each column, it corresponds to the aggregated data of a specific month ranges from 1 to m. For example, the pcpn_1 corresponds to the average perception of the first month, and avgt_1 corresponds to the average temperature of the first month. Here, the first month actually corresponds to April instead of Janurary because the corn is planted in April.
The training process is relatively straightforward in this project:
Assume there are c counties, there will be 12 * c models trained because there are 12 months from November to next October. An animation is shown below to describe this process:
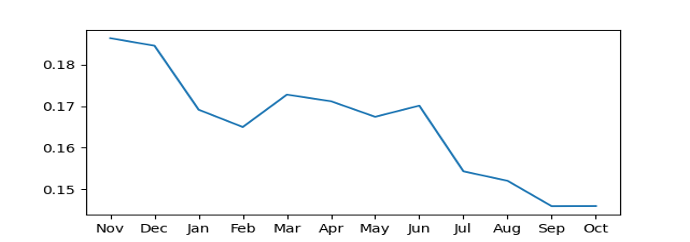
It can be expected that the model corresponding to the Next October will give more accurate prediction because there is more data to utilize. To validate this, 20 counties were used to get the average test mean absolute percentage error (MAPE) of 12 models corresponding to 12 months. It can be seen that the model that corresponds to October does achieve the lowest MAPE error as expected. In the MAPE plot, we observe that there are two sharp decrease or MAPE, which happen between Nov. - Jan. and Jun. - Sep. It is not surprising that the weather data from June to September helps explains variance of corn yield residuals after linear regression, because the weather within this range is significantly important for corn growth. However, the weather data way before the growing season (November to Janurary) also contributes to the model prediction is unexpected. Possible reason according to this article is that: winter precipitation reserves more moisture in the soil moisture reserves, which ultimately increases the corn yield.
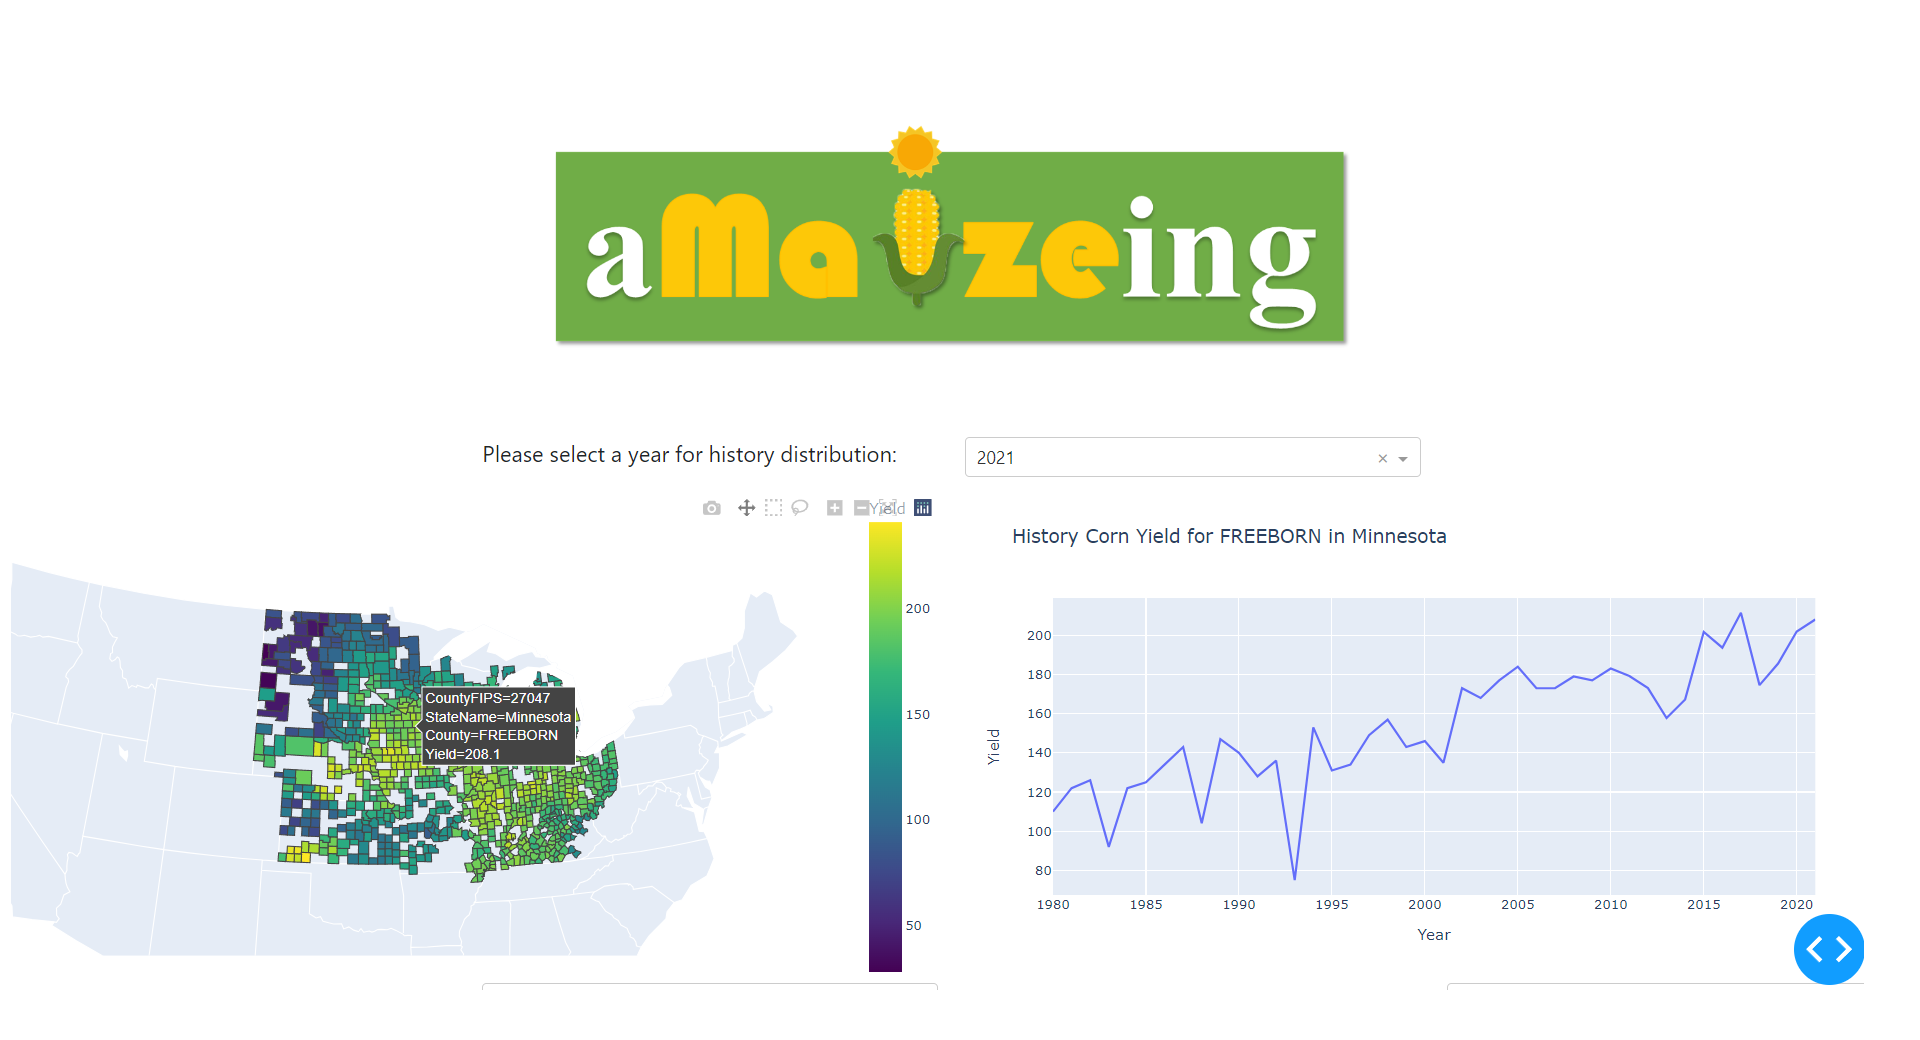
A web app based on dash plotly has been deployed to the Heroku platform (It might take about 10 seconds to load the website at the first time), so anyone can access this model to get a real time monthly corn yield prediction for a specific county in the corn belt area. The layout is as follows: First, you can visualize the historical corn yield distribution in the corn belt area. And by changing the dropdown of years, you can visualize the distribution in this area in differenct year. Also, when you click a county you are interested, the right panel will display the corn yields over years.
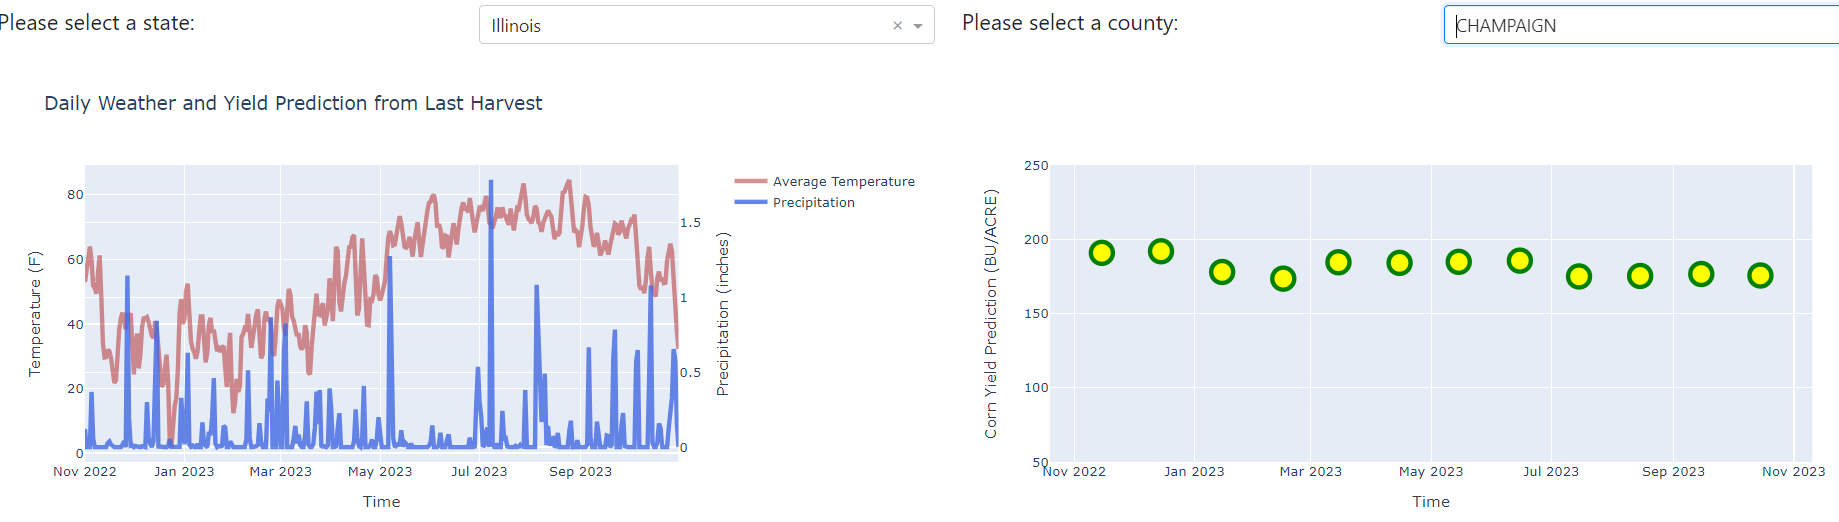
Second, you can get a real time corn prediction for each specific county by changing the two dropdowns. For example, currently, we are checking the Champaign county in Illinois. The left panel is displaying the weather data (temperature and precipitation) from last November to this October. And the right panel is showing the predictions corresponding to the last 12 months. Since currently it is November, and therefore we have the entire 12 models. If the current date is July, then we will only have six models which correspond to last November to this June.
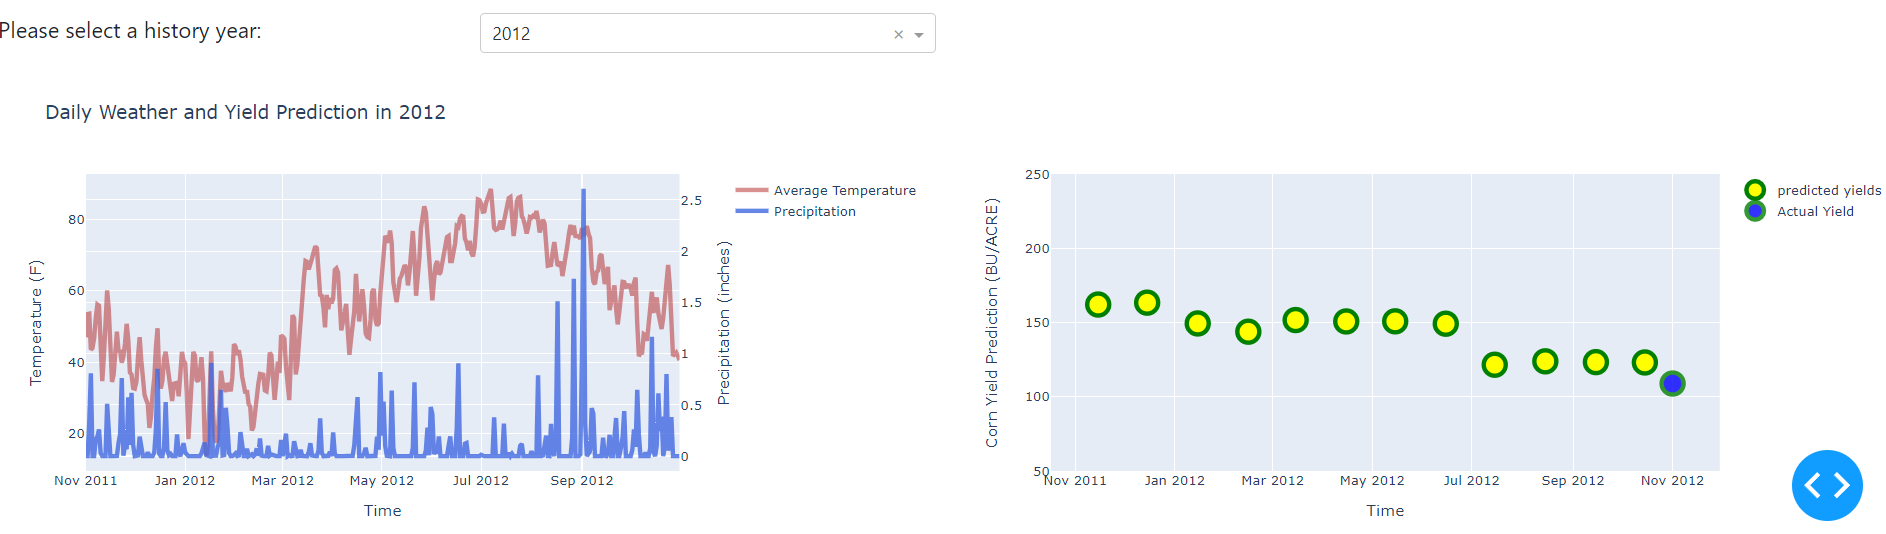
Lastly, you can select any year within 1980 - 2021 to visualize how this model behaves. For example, we are still looking at Champaign county in Illinois. However, this time we are interested in year 2012 to see how the models are updating the corn yields from November to next October. We can see that in this particular year, Champaign county had been suffering from low precipitation since March to August. The low precipitation is critical to corn growth and this year's corn yield is expected to be low. In the right panel, we can see that our models successfully reacted to the low precipitation and keeps lower the predictions month by month and finally gives a reasonable prediction.
In this project, a corn yield prediction model is trained using weather data and a web app is deployed so anyone can access it. More specifically:
This model achieved reasonable performance by weather data such as precipitation and temperature, however, there are many factors that can influence the corn yield such as the soil quality, the fertilizer used by farmers, or even the price of corn. Therefore, more data will be scrapped and added to this model to make more accurate predictions.